Quant Analyzer Portfolio Report
Portfolio
Total Profit
$ 150287.38
Profit in pips
169877.3 pips
Yrly Avg profit
$ 12523.5
Yrly Avg % ret
12.52 %
CAGR
7.95 %
# of trades
8924
Sharpe ratio
0.08
Profit factor
1.4
Return / DD ratio
18.66
Winning %
26.4 %
Drawdown
$ 8055.85
% Drawdown
5.88 %
Daily Avg profit
$ 34.31
Mthly Avg profit
$ 1043.66
Average trade
$ 101.49

Strategies in portfolio
| # | Name | Symbol | Timeframe | Net Profit ($) | Net Profit (pips) | # of Trades | Sharpe Ratio | Profit Factor |
| S2 | AJ | AJ | unknown | $ 11549.92 | 13099 pips | 738 | 0.1 | 1.43 |
| S3 | AN | AN | unknown | $ 5236.53 | 7304.4 pips | 389 | 0.12 | 1.43 |
| S4 | CJ | CJ | unknown | $ 9355.02 | 10613 pips | 528 | 0.1 | 1.33 |
| S5 | EA | EA | unknown | $ 13090.98 | 17020.6 pips | 1666 | 0.05 | 1.18 |
| S6 | EC | EC | unknown | $ 9880.72 | 12966.6 pips | 567 | 0.09 | 1.29 |
| S7 | EJ | EJ | unknown | $ 16605.24 | 18843.1 pips | 549 | 0.14 | 1.68 |
| S8 | EU | EU | unknown | $ 15354.8 | 15354.8 pips | 730 | 0.11 | 1.45 |
| S9 | GJ | GJ | unknown | $ 37421.51 | 42447.3 pips | 1167 | 0.11 | 1.63 |
| S10 | GU | GU | unknown | $ 21487.3 | 21487.3 pips | 856 | 0.09 | 1.4 |
| S11 | UJ | UJ | unknown | $ 10305.36 | 10741.2 pips | 1734 | 0.06 | 1.31 |
| # | Name | Return / DD Ratio | Winning % | Drawdown | % Drawdown | Yearly avg. profit | Monthly avg. profit | Daily avg. profit |
| S2 | AJ | 7.89 | 34.34 % | $ 1463.65 | 13.99 % | $ 969.07 | $ 80.77 | $ 3.75 |
| S3 | AN | 3.49 | 25.71 % | $ 1500.96 | 9 % | $ 550.85 | $ 45.93 | $ 1.91 |
| S4 | CJ | 5.81 | 34.79 % | $ 1610.68 | 15.09 % | $ 984.4 | $ 82.06 | $ 3.55 |
| S5 | EA | 4.63 | 26.33 % | $ 2826.26 | 21.71 % | $ 1090.97 | $ 90.91 | $ 3.09 |
| S6 | EC | 4.27 | 34.47 % | $ 2312.5 | 10.47 % | $ 823.92 | $ 68.62 | $ 2.63 |
| S7 | EJ | 10.26 | 32.31 % | $ 1618.53 | 15.78 % | $ 1404.64 | $ 116.94 | $ 5.96 |
| S8 | EU | 7.79 | 29.45 % | $ 1972.3 | 10.16 % | $ 1279.71 | $ 106.63 | $ 4.47 |
| S9 | GJ | 17.08 | 23.29 % | $ 2190.48 | 21.9 % | $ 3116.86 | $ 259.87 | $ 9.44 |
| S10 | GU | 7.45 | 22.78 % | $ 2883.7 | 18.05 % | $ 1789.27 | $ 149.22 | $ 5.06 |
| S11 | UJ | 3.62 | 16.17 % | $ 2842.98 | 17.71 % | $ 858.66 | $ 71.57 | $ 2.7 |
Monthly Performance ($)
| Year | Jan | Feb | Mar | Apr | May | Jun | Jul | Aug | Sep | Oct | Nov | Dec | YTD |
| 2016 | 321.44 | 2519.2 | -2277.81 | 547.16 | -1051.56 | -1423.06 | 770.97 | -898.29 | 2371.6 | 1856.85 | 645.05 | -605.23 | 2776.32 |
| 2015 | -162.07 | 1629.16 | -699.53 | 4676.66 | -1821.08 | 192.09 | -752.52 | -499.64 | -1974.78 | 1783.96 | 2247.99 | 1879.03 | 6499.27 |
| 2014 | -141.23 | 438.75 | 70.47 | 97.7 | -538.47 | -1256.78 | 2198.63 | 1036.04 | 801.3 | 7558.17 | 837.28 | 2921.93 | 14023.79 |
| 2013 | 2953.8 | 2243.5 | 645.98 | 1925.08 | -547.56 | 935.6 | 1676.23 | -1215.7 | -74.74 | -832.01 | 4984.8 | -1432.68 | 11262.3 |
| 2012 | 1419.33 | 1858.52 | -1019.15 | -620.66 | 4395.52 | -124.06 | -950.39 | 1319.71 | -786.64 | -510.23 | 6992.37 | -965.46 | 11008.86 |
| 2011 | 464.88 | 144.09 | 5369.32 | -258.77 | 408.28 | 1443.29 | -268.81 | 3777.13 | -599.54 | 2918.89 | 710.05 | 1527.89 | 15636.7 |
| 2010 | 3717.03 | 854.94 | 1904.75 | 56.78 | 6306.15 | 1241.26 | -1258.39 | -1386.79 | -262.17 | -1189.26 | -140.16 | -1609.88 | 8234.26 |
| 2009 | 2171.71 | 896.17 | 4223.15 | 3589.99 | 896.03 | -1774.6 | 3662.53 | -1918.43 | -132.06 | 627.17 | 875.3 | 1798.06 | 14915.02 |
| 2008 | -1011.87 | 3677.29 | -2548.69 | 1057.95 | -519.72 | 368.85 | 8375.48 | 3729.37 | -527.3 | 18836.11 | 2698.58 | 11105.58 | 45241.63 |
| 2007 | -218.26 | -199.68 | 1610.61 | 587.01 | -1679.44 | 2488.21 | 1156.42 | -2313.04 | 2617.71 | 353.1 | 3386.06 | 1321.62 | 9110.32 |
| 2006 | 1999.15 | -1276.06 | 1139.57 | 2708.89 | -71.27 | 16.47 | 1006.93 | -1390.4 | 2665.23 | 1175.55 | 601.11 | -156.97 | 8418.2 |
| 2005 | -831.3 | -850.86 | -657.66 | -1143.77 | 4871.48 | -646.98 | -23.52 | -809.64 | 2102.64 | -260.41 | 150.98 | 1259.75 | 3160.71 |
Stats
Strategy
| Wins/Losses Ratio | 0.36 | Payout Ratio (Avg Win/Loss) | 3.9 | Average # of Bars in Trade | 0 |
| AHPR | 0.01 | Z-Score | -27.29 | Z-Probability | 99.9 % |
| Expectancy | 16.84 | Deviation | $ 204.87 | Exposure | -999999999 % |
| Stagnation in Days | 236 | Stagnation in % | 5.39 % |
Trades
| # of Wins | 2121 | # of Losses | 5913 | # of Cancelled/Expired | 890 | ||
| Gross Profit | $ 527988.58 | Gross Loss | $ -377701.2 | Average Win | $ 248.93 | Average Loss | $ -63.88 |
| Largest Win | $ 2137.2 | Largest Loss | $ -493.9 | Max Consec Wins | 11 | Max Consec Losses | 64 |
| Avg Consec Wins | 2.09 | Avg Consec Loss | 6.69 | Avg # of Bars in Wins | 0 | Avg # of Bars in Losses | 0 |
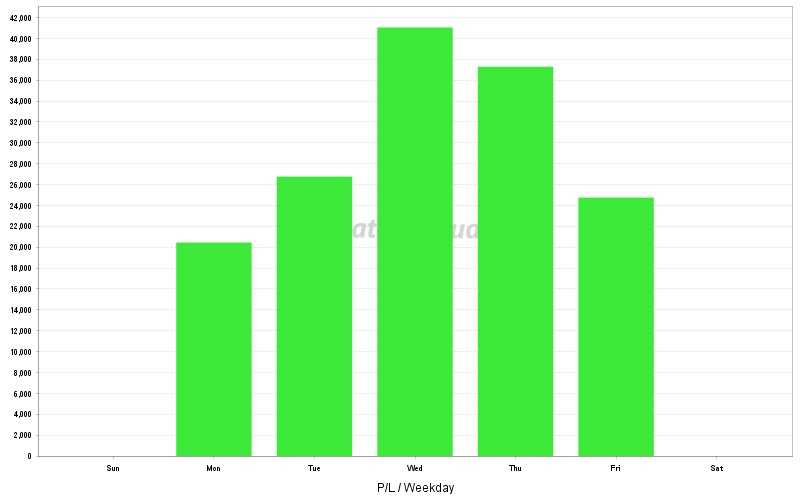
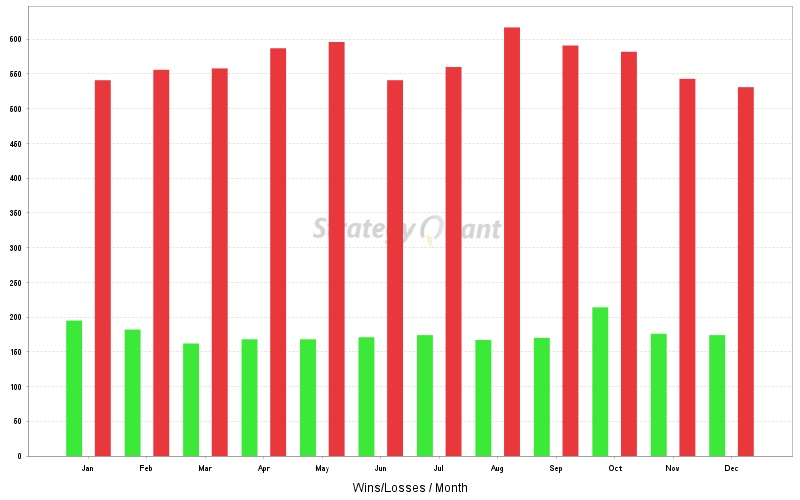
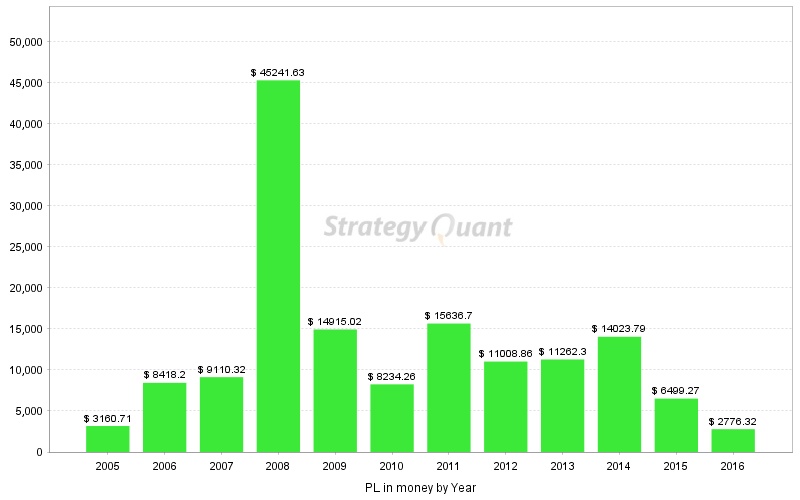
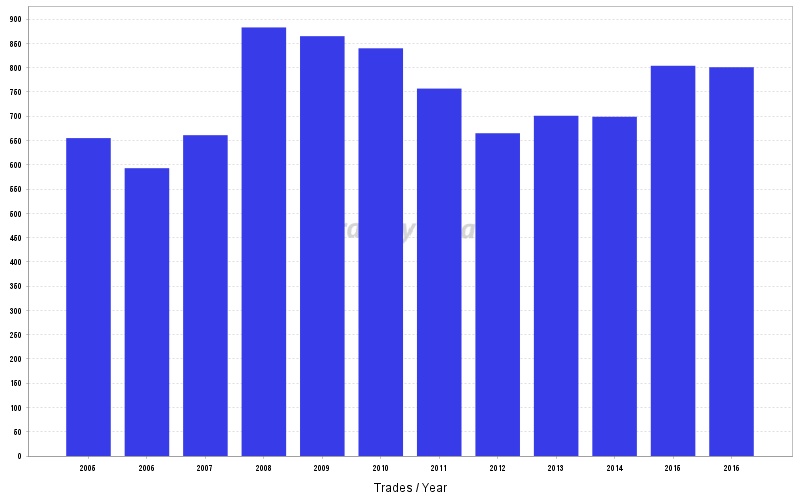
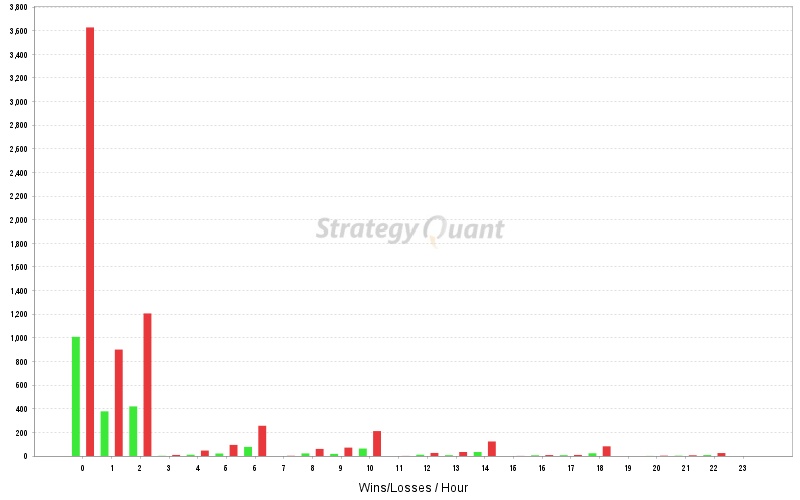
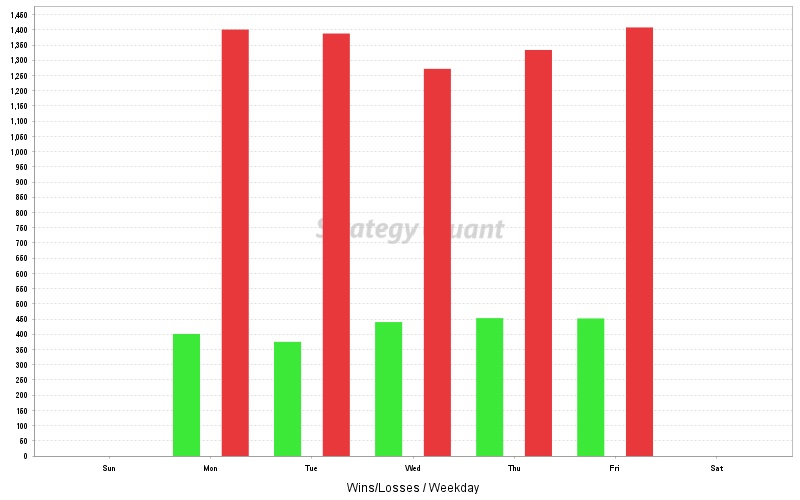
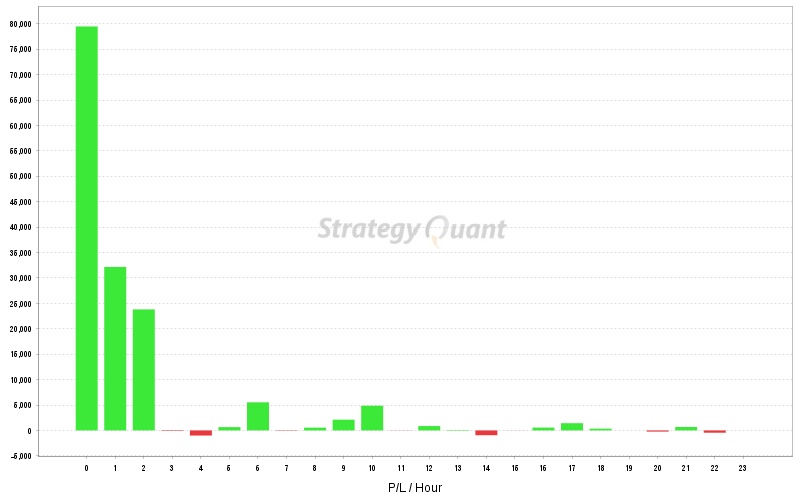
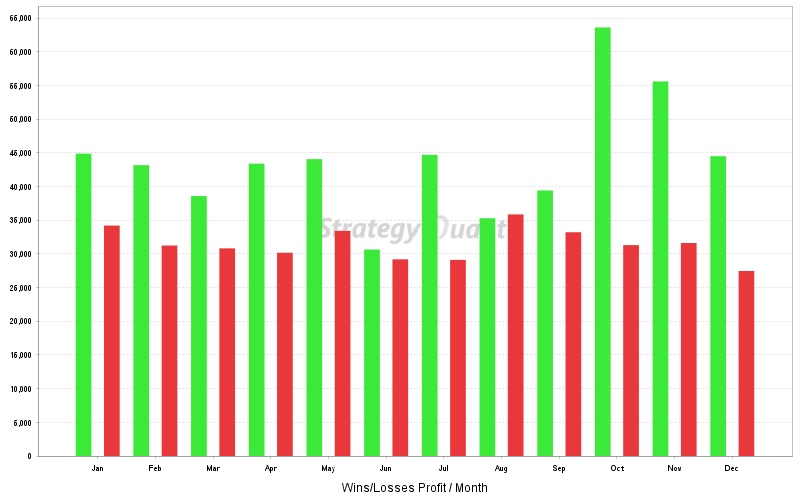
Charts
Click on the chart to see bigger image